

-
Click Reporting>Custom Power BI Reports.
Custom Reports were previously found in the Invoice Analytics drop-down menu.
-
Click Create a New Report.
-
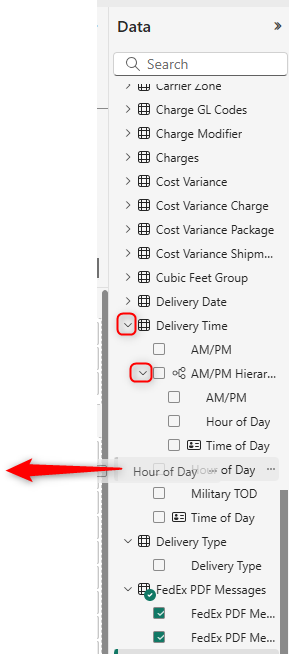
Expand Data folders and select or dragged desired data to the white space (canvas).
Only drag and drop the lowest level data from the expanded hierarchy.
-
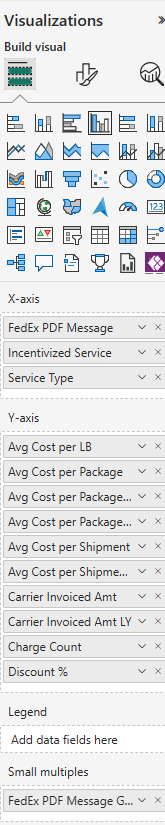
Change the image by selecting from the Visualizations column.
-
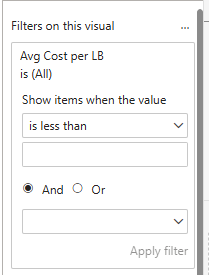
In the Filters column, expand filters in use and select from options.
-
Click into a different section of the canvas to add additional data and visuals.
-
Select options at the bottom of the page:
|
Icon |
Description |
|---|---|
|
|
Desktop layout |
|
|
Add Page |
|
|
Mobile layout |


-
Once you have created all the data needed for the report, click Save.
-
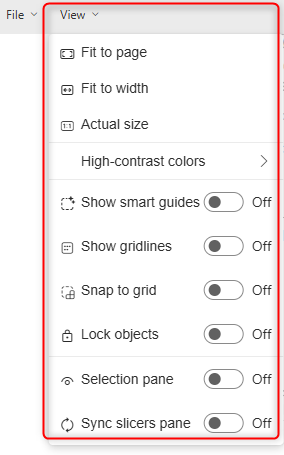
Click View to select how the report data displays.
-
Click File>Save As and type a name for the report. Click Save.
-
Click Invoice Analytics>Custom Reports. The name of the report created appears in a table. Use the following icons to manage report:
|
Icon |
Description |
|---|---|
|
|
View |
|
|
Edit |
|
|
Delete |


