

The home page offers quick insight, access to common reports, and actionable data. This page allows you to access the most relevant data quickly.
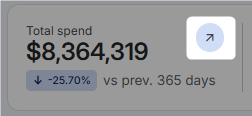
KPIs that open a report now have a visual indicator. Click indicator to open report. Refer to Linked Home Page Reports by Mode.
Follow these instructions to navigate the home page:
-
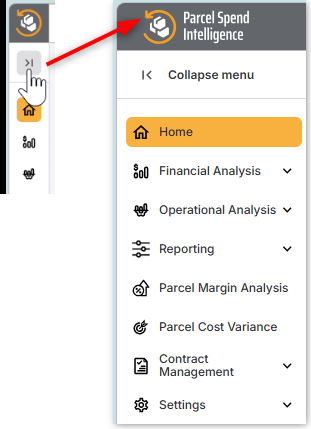
From the navigation menu, click Home. To expand the names of the navigation menu, click the arrow at the top of the bar.
-
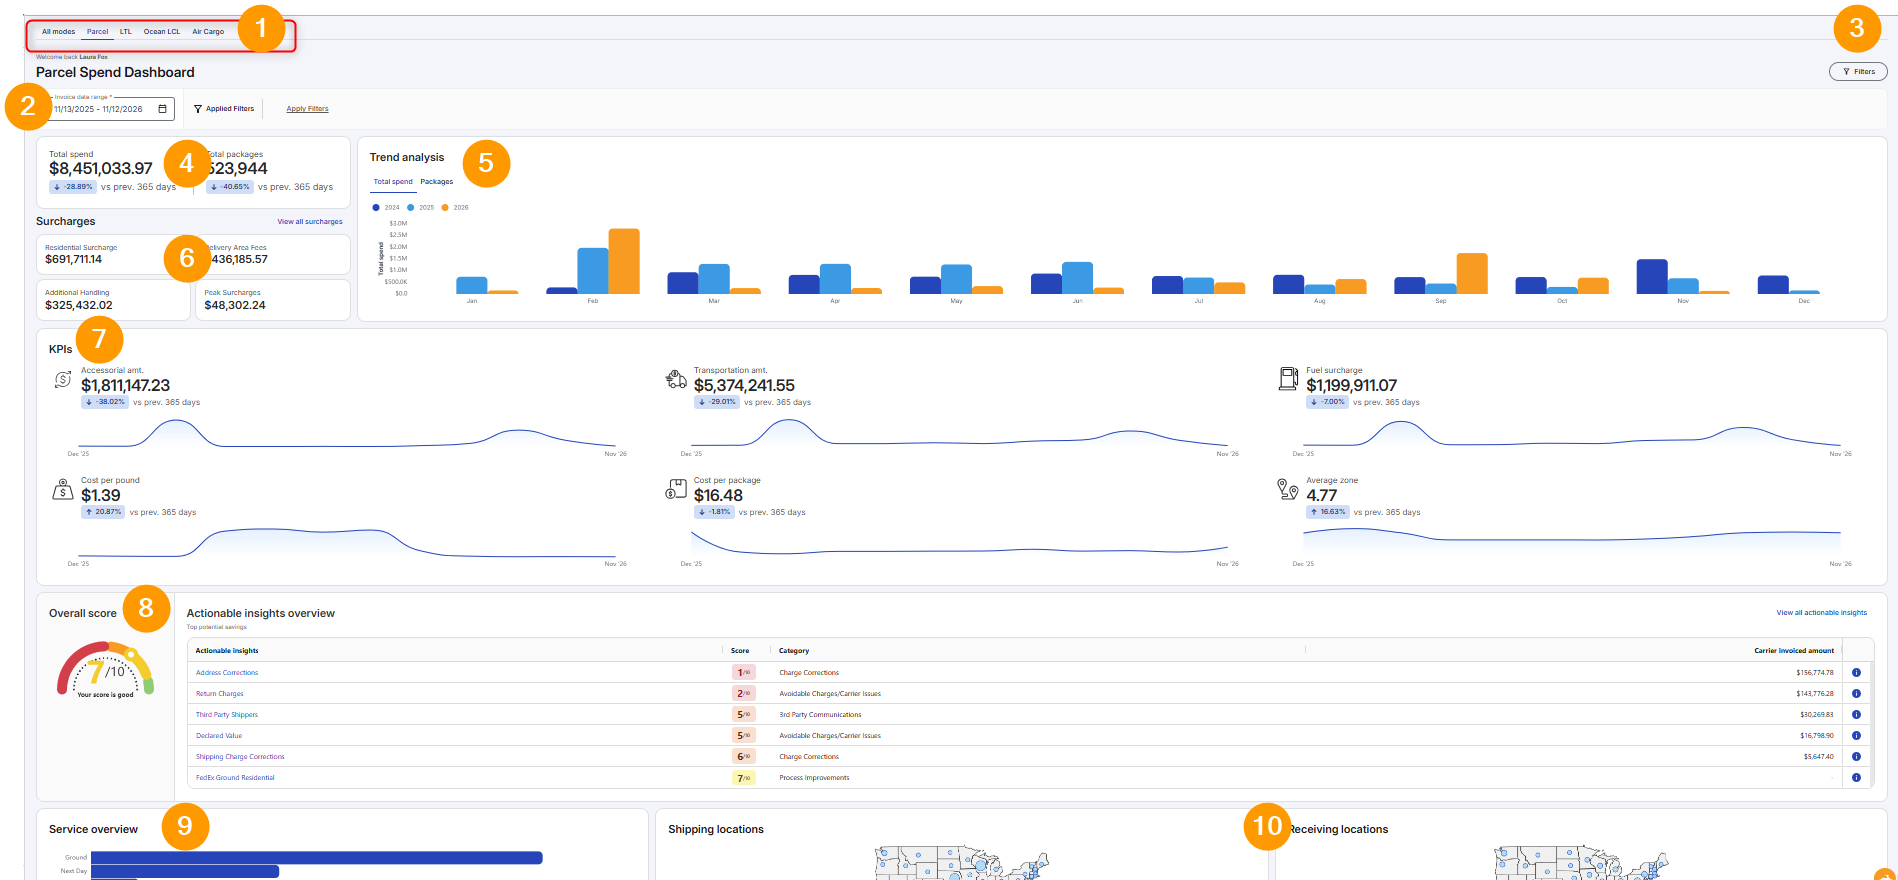
The numbered graphic and table below describe key features of the PSI tab (defaults):
|
Feature |
Description and Instructions |
|
|---|---|---|
|
1 |
Mode tabs 🆕 |
The tabs you see depend on whether you have Parcel and Freight. All modes - PSI and freight data. Parcel - Parcel Spend Intelligence (PSI) LTL (Less than Truckload) - your shipment shares trailer space with other shippers' freight. Ocean LCL (Less Than Container Load) - your cargo shares a container with shipments from other companies. All Cargo - Freight aircraft with no passenger seats. |
|
2 |
Filter bar
|
Use the filter bar to narrow the data:
|
|
3 |
Filters
|
Click to select Carrier, Account, Service Type, Shipment Type, Account Group, Sender Group, Receiver Group, and/or Zone, refer to PSI Apply Filters. |
|
4 |
Key metrics
|
Top Key Performance Indicators (KPIs) determined by your company surveys. Carrier agnostic and sender/receiver heat map. Click tile to view the associated report.
|
|
5 |
Trend Analysis
|
Tile has two tabs: Total spend and Packages. Click the year to deselect/select year. 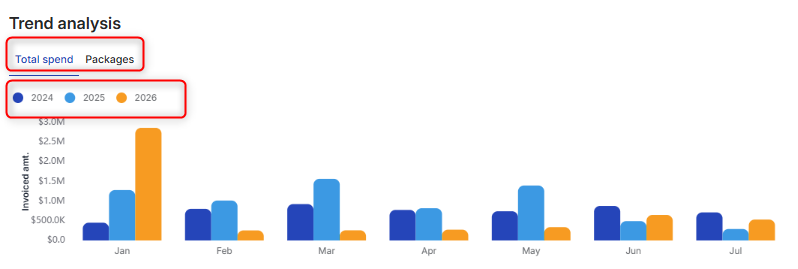
|
|
6 |
Surcharges 🆕
|
Displays the top 4 surcharges. To view Accessorial Analysis, click View all surcharges hyperlink. Refer to Accessorial Analysis. |
|
7 |
KPIs
|
Core KPIs display. Hover line graph to view data points. To view report with selected filters, hover over the tile’s top-right corner and click the arrow. |
|
8 |
Actionable Insights overview
|
Top 6 most impactful actionable insights by dollar amount.
|
|
9 |
Service overview
|
Click a Service Overview bar to open Parcel Spend Overview report with selected service filtered. Refer to Parcel Spend Overview. 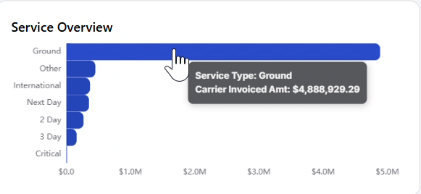
|
|
10 |
Shipping locations or Receiving locations |
Click a data point on the Shipping Locations or Receiving Locations tile to open the Receiver/Sender Analysis Report with selected data point filtered. Refer to Sender Receiver Analysis. 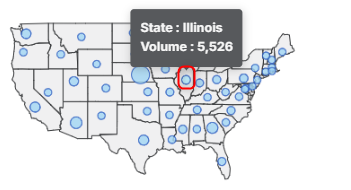
|

-
The following table lists additional data shown on other modes:
|
Tile Name |
Mode tab |
Description |
|---|---|---|
Spend breakdown
|
All modes |
Shows total spend by charge category (Surcharges, Transportation, Fuel, Gov’t, and Misc.), so you can see where most of your money goes. 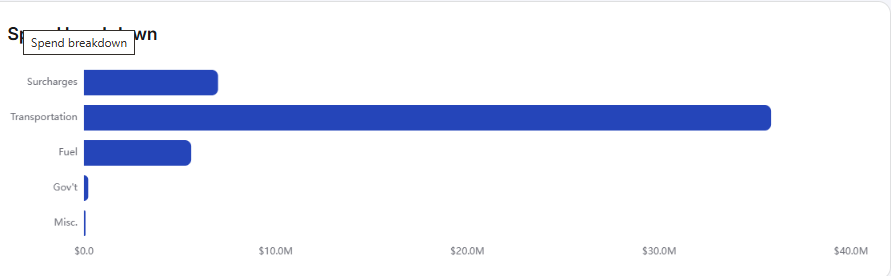
|
Mode breakdown
|
All modes |
Shows how much spend there is per mode. 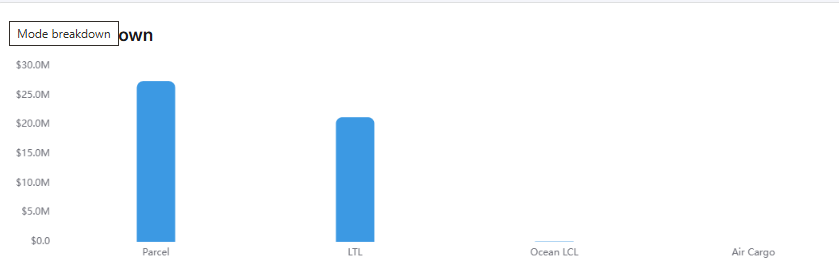
|
Top shipping lanes
|
LTL, Ocean LCL, and All Cargo |
Replaces the parcel service-level KPI for freight modes.
|