

The following table describes ways to sort and view information in most grids.
|
Feature |
Description |
|---|---|
Expand Row
|
If a row item has a + sign, it can be expanded. Click the + sign to expand and the - sign to collapse. 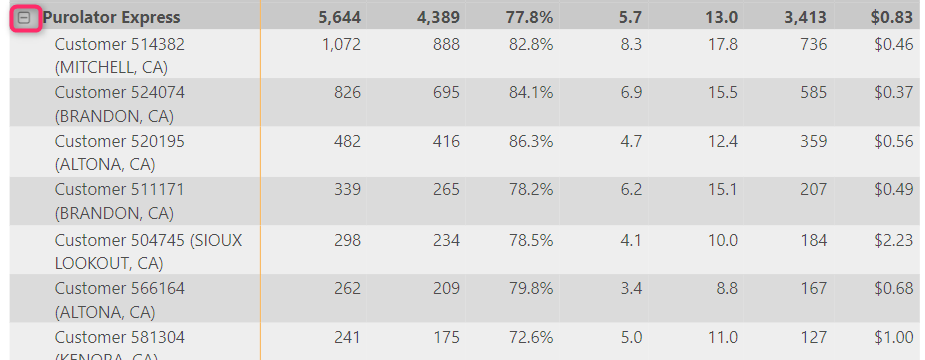
Some pages may have arrows to expand/collapse such as GL Coding. 
Some rows have arrows that expand the data. 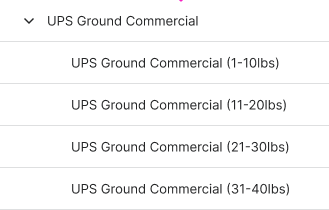
|
Filters
|
Click side arrow to expand and select filters.
The filters under the heading Filters on all pages will carry throughout the application. The filter(s) display orange and stay expanded when you navigate to another page. 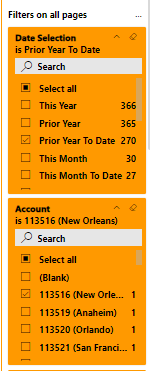
|
More Options
|
The upper right corner of grids contains additional options. You may have to hover over the section to display. This is also available on other graphics like a bar graph. 
The “…” or ellipsis contains additional options such as Export Data. 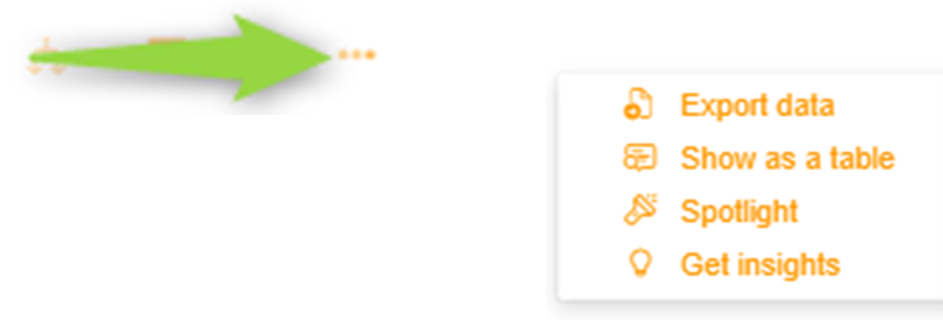
|
Right-Click
|
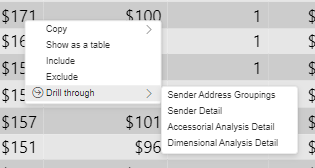
Right-click on grid data displays additional items such as copy and drill through. Drill through options change depending on the data being viewed.
|
Select Grid Row
|
If you select a row in a grid the other visual data on the page (such as a bar and line graph) changes for the specific selection. This is also true of selecting a portion of a bar or line graph. The grid data will change to reflect the selection.
|
Sort Columns
|
At the top of each column there is an arrow to sort. Click arrow to change. 
|